Continuous Intelligence
This site provides documentation for this project. Use the navigation to explore module-specific materials.
How-To Guide
Many instructions are common to all our projects.
See ⭐ Workflow: Apply Example to get these projects running on your machine.
Project Documentation Pages (docs/)
- Home - this documentation landing page
- Project Instructions - instructions specific to this module
- Your Files - how to copy the example and create your version
- Glossary - project terms and concepts
Custom Project
Dataset
This project used two datasets to apply rolling monitoring techniques.
The first dataset was our class provided dataset which contained system metrics, including requests, errors, and total latency, representing system performance over time.
The second dataset was a healthcare patient flow dataset containing patient admission date and time, wait time, and satisfaction scores.
For both datasets, timestamps were used or created to enable time-series analysis. In the healthcare dataset, a timestamp was constructed by combining admission date and time fields.
Signals
Rolling signals were created to analyze trends over time in both datasets.
For the system metrics dataset: - Error rate signal (errors divided by requests) - Rolling mean of latency - Rolling indicators for system performance trends
For the healthcare dataset: - Rolling mean of patient wait time - Rolling maximum of patient wait time - Rolling mean of patient satisfaction score (limited due to missing data)
These signals helped smooth short term variation and highlight both average behavior and extreme values.
Experiments
First, I modified the original system metrics rolling monitor to understand how rolling statistics behave in a controlled dataset. I computed rolling averages and interpreting system performance trends.
The second phase applied these same techniques to a new healthcare dataset. Additional modifications included: - Creating timestamps from separate date and time fields - Cleaning and converting numeric data - Adjusting rolling window size to improve interpretability of a visual
Experiments with different window sizes showed that smaller windows produced noisy signals, while larger windows produced smoother and more interpretable trends. A window size of 50 was used for the healthcare dataset.
Results
In the system metrics dataset, rolling signals revealed patterns in system performance, including changes in error rate and latency over time.
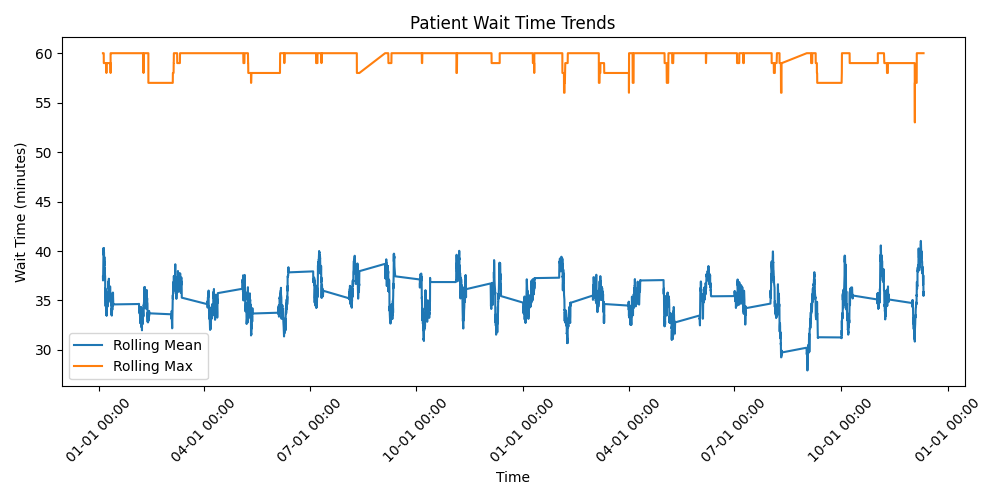
In the healthcare dataset, the rolling mean of patient wait time remained relatively stable, generally between approximately 33 and 38 minutes. However, the rolling maximum frequently reached values near 60 minutes, indicating recurring peak wait times.
The visualization showed that while average performance was steady, variability persisted with consistent spikes in maximum wait time. Patient satisfaction data contained many missing values, limiting its usefulness for rolling analysis.
Visualization
Interpretation
The system metrics analysis demonstrated how rolling signals can effectively track performance trends and detect changes in system behavior over time.
Applying these techniques to healthcare data showed that even when average performance appears stable, peak values can reveal important operational issues. The consistently high maximum wait times suggest bottlenecks or inefficiencies in patient flow, such as staffing constraints.
Additionally, the large number of missing satisfaction scores highlights a data quality limitation, indicating that patient feedback is not consistently captured. Overall, this project demonstrates how rolling monitoring can be applied across different domains to generate meaningful business intelligence.